In an age where attention spans are fleeting and choices abundant, the success of any online platform hinges on its ability to provide seamless, swift, and engaging interactions. In fact, 40% of visitors will leave a website if it takes longer than three seconds to load.
With just a one second delay potentially causing a significant drop in user engagement, conversion rates, and overall satisfaction, it’s imperative that web developers prioritize immediacy. This rings especially true for Ruby on Rails applications, the backbone of many dynamic websites and web services.
In JetRocket we care about our applications performance a lot. Performance in my opinion is not only a server response time. Of course responses should always be fast, but deployments, tests and application front-end should also run on maximum speed. Within almost 15 years of our history we collected a quite vast collection of tools and techniques that help us to provide the best performance to our clients projects.
Database Problems & Tools
# 1 Bullet
The first that comes in mind when you hear about database performance issues in Rails would probably be a N+1 problem. The N+1 problem occurs when an application makes N+1 database queries to retrieve related data. In the context of Rails, this often happens when you have a parent model and associated child models, and you retrieve a list of parent records along with their associated child records. Each parent record is retrieved with an additional query to fetch its associated child records. This can lead to a significant increase in the number of database queries and negatively impact the application’s performance.
The Bullet gem is designed to enhance your application’s performance by minimizing the frequency of queries it executes. During your application development, it actively monitors your queries and provides alerts when you should consider implementing eager loading (to avoid N+1 query issues), when unnecessary eager loading is detected, or when you should make use of counter cache.
Bullet allerts can be sent via browser JavaScript based popups, log files, with different monitoring systems or even with Slack.
# 2 N+1 Control
While Bullet is designed to detect and N+1 queries in development, N + 1 Control designed to be used in tests. It evaluates the code under consideration several times with different scale factors to make sure that the number of DB queries behaves as expected.
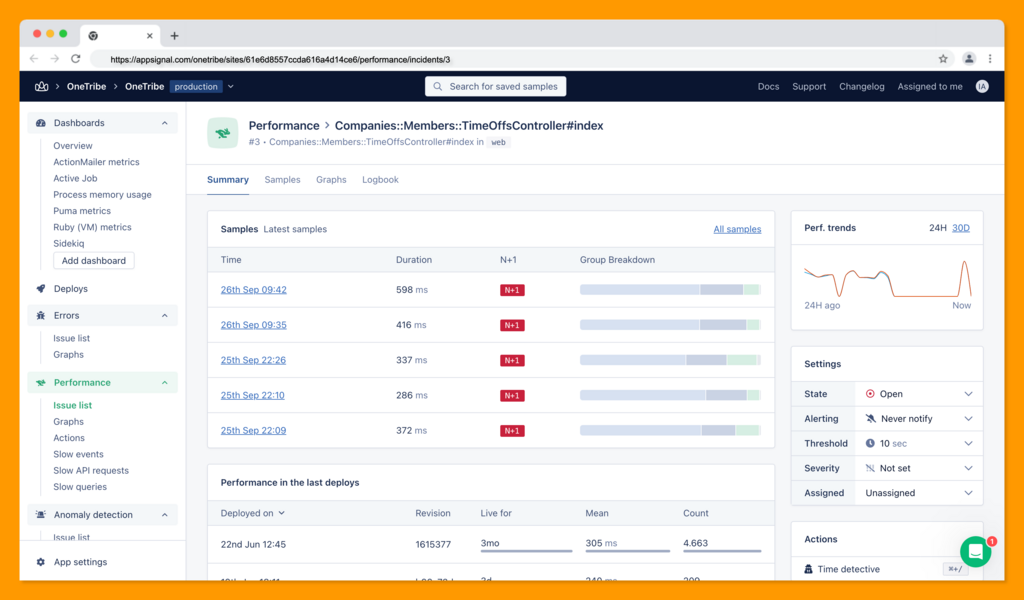
#3 NewRelic, AppSignal, RoRvsWild and other APM systems
These tools offer various features and integrations that can assist you in monitoring and diagnosing N+1 query problems and other performance issues in your Ruby on Rails applications.

Above is the screenshot from AppSignal indicating request having N+1 problem.
#4 PgHero
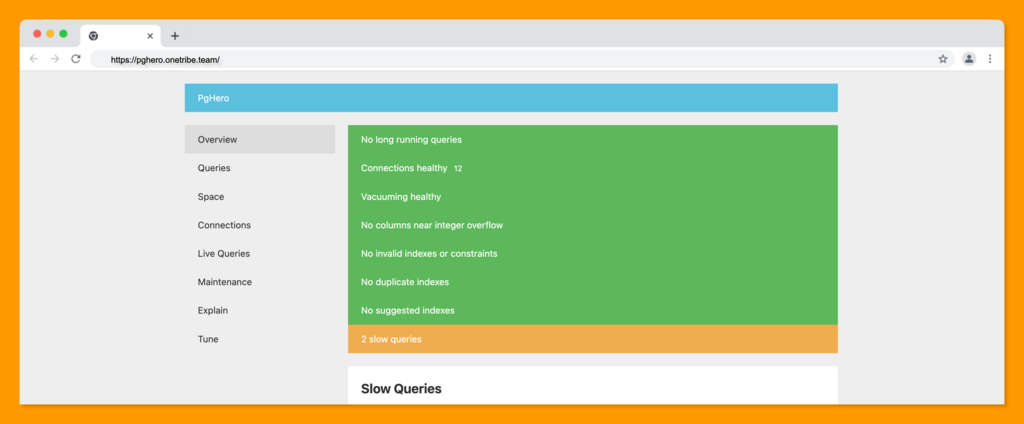
PgHero is a powerful database optimization web dashboard explicitly designed for PostgreSQL. Founded by Andrew Kane, PgHero offers comprehensive features and insights to help users identify and resolve performance bottlenecks, ensuring their applications run efficiently and smoothly.
One of PgHero’s standout features is its real-time dashboard, which gives users a holistic view of their database’s performance metrics. This includes information on query execution times, slow queries, database locks, and more. With this dashboard, users can quickly pinpoint areas that require attention and take proactive measures to optimize their database queries and configurations. Additionally, PgHero offers historical query analysis, allowing users to track query performance over time and identify trends or anomalies.

PgHero is distributes as a Rails Engine or Docker image, which seems a better option for me and can be easily added to your Rails application deployed with Kamal as an accessory.
#5 Rails PG Extras
Of course many of you know that Postgres stores a lot of its internal metrics and params and they are available through different views. Likewise if you need to get information about used and not used indexes you will probably query pg_stat_user_indexes view (More information can be found in the official PostgreSQL documentation).
The goal of Rails PG Extras is to offer robust insights from your PostgreSQL databases. It encompasses both rake tasks and Ruby method designed to retrieve data regarding a Postgres instance. It encompasses details such as locks, index utilization, buffer cache hit ratios, and vacuum statistics. Through the Ruby API, developers can seamlessly incorporate this tool into tasks like automated monitoring.
#6 Strong Migrations
Strong Migrations catches unsafe migrations in development, and while having potentially dangerous operations in migrations does not affect your application perfomance directly, adding index non concurrently or adding a foreign key can slow down your application while you will deploy a new release.
Anyway, keeping your migrations well organized is just another way to improve your application overall quality and improve team knowledge, this is why we have strong migrations gem in all our projects.
#7 Database Validations
Another gem that makes your codebase not only faster, but better in general is database validations. It implements two new methods for ActiveRecord: db_belongs_to and validates_db_uniqueness_of . As you can guess they work similar to existing active record methods, but work on a database level. Based on benchmarks included to the gem it is 2.5x times faster than active record methods. Besides it ensures real uniqueness of values and has build it Rubocop rules to force your team to use it.
#8 Database Consistency
Database consistency gem created by Evgeniy Demin, author of database_validations. he main goal of the project is to help you avoid various issues due to inconsistencies and inefficiencies between a database schema and application models.
Lintering & Audit
You probably already have Rubocop configured in your project to to provide unified code style and keep the code base in a good shape.
#9 RuboCop Performance
- https://docs.rubocop.org/rubocop-performance/cops_performance.html
- https://github.com/rubocop/rubocop-performance
RuboCop rules can improve not only your code style but also the performance of your code. This is where rubocop-performance gem comes in place. Look at a couple of examples below for nonobvious performance improvements.
Case insensitive string comparison is faster with String#casecmp compared to String#downcase plus ==.
# Performance/Casecmp

# bad
str.downcase == 'abc'
str.upcase.eql? 'ABC'
'abc' == str.downcase
'ABC'.eql? str.upcase
str.downcase == str.downcase

# good
str.casecmp('ABC').zero?
'abc'.casecmp(str).zero?
When working with arrays you can modify existing Array instead of creating a new intermediate array for each iteration.
# Performance/ChainArrayAllocation

# bad
array = ["a", "b", "c"]
array.compact.flatten.map { |x| x.downcase }

# good
array = ["a", "b", "c"]
array.compact!
array.flatten!
array.map! { |x| x.downcase }
array
#10 Fasterer
Another tool that can be used for automated code performance improvements is Fasterer. Fasterer is based on FastRuby https://github.com/fastruby/fast-ruby idioms and can be configured to run in your CI/CD pipeline.
#11 bundler-leak
Another tool from fast-ruby that may help you is bundler-leak. It analyzes your Gemfile over the RubyMem database and provides you information what parts of your bundle may have memory leaks. I usually have bundler-leak as a part of my CI/CD pipeline.
Data Serialization
Speed in data serialization is crucial because it directly impacts the efficiency and performance of your applications. As a Ruby programmer, you understand the importance of optimizing code for better execution. When data serialization to JSON is fast, it reduces the overhead of converting data into a human-readable format, allowing your applications to transmit and receive data swiftly.
As far as I know there are two serializers that can be declared as fastest in Ruby world.
#12 Panko
Panko is inspired by ActiveModelSerializers (which is currently not in an active development https://github.com/rails-api/active_model_serializers#status-of-ams), but works much faster https://panko.dev/docs/performance.html.
The performace result is achieved by four approaches:
- Using C extension of OJ library
- Incremental serialization of Ruby arrays
- Type casting that does not rely on ActiveRecord
- Figuring out the metadata, ahead of time
Of course like in any other library there are some cons: Panko can serialize only ActiveRecord objects.
#13 Alba & OJ
Compared to Panko, Alba can serialize any Ruby object and do it fast by using OJ library as backend (Alba allows to configure different backends).
#14 GraphQL Performance Tools
When dealing with GraphQL API’s, that I usually use when building mobile applications, you cannot premelerirary optimize your queries, like you do in REST. There is not silver bullet that will make everything work faster, however there is a batch of tools that may help you.
- GraphQL Batch https://github.com/Shopify/graphql-batch
- ArLazyPreload https://github.com/DmitryTsepelev/ar_lazy_preload
- GraphQL::PersistedQueries https://github.com/DmitryTsepelev/graphql-ruby-persisted_queries
- GraphQL::FragmentCache https://github.com/DmitryTsepelev/graphql-ruby-fragment_cache
Profiling
Profiling allows you to identify bottlenecks and areas of improvement in your applications.
#15 Rack Mini Profiler, Stackprof & MemoryProfiler
- https://github.com/MiniProfiler/rack-mini-profiler
- https://github.com/tmm1/stackprof
- https://github.com/SamSaffron/memory_profiler
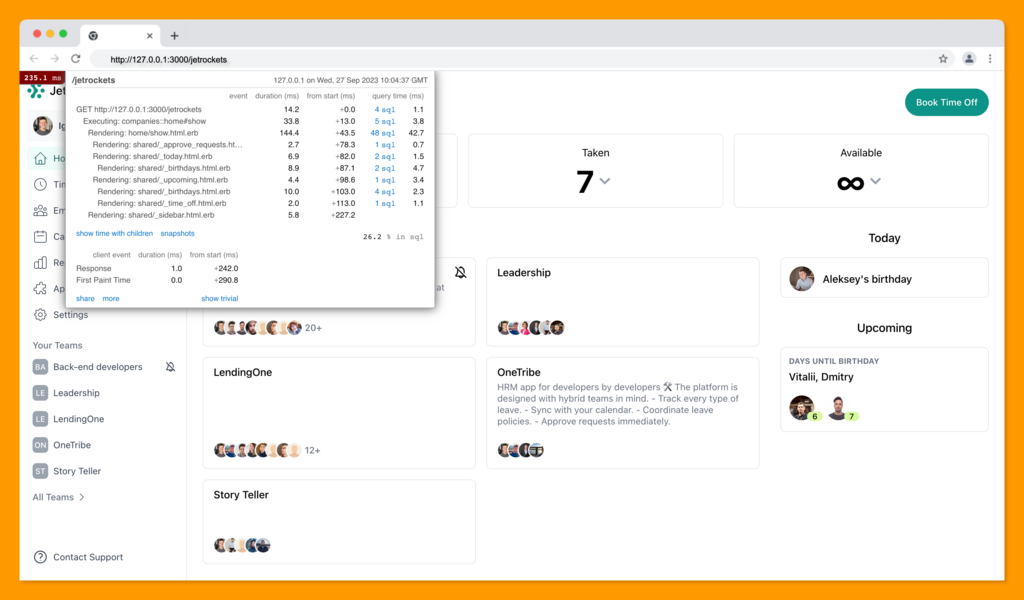
When I hear about profiling in Rails, I always think about Rack Mini Profiler. This Rack middleware for Ruby web applications enables real-time profiling and performance monitoring. With stackprof it can also provide flamegraphs. I especially love that it is designed to work both in production and development.

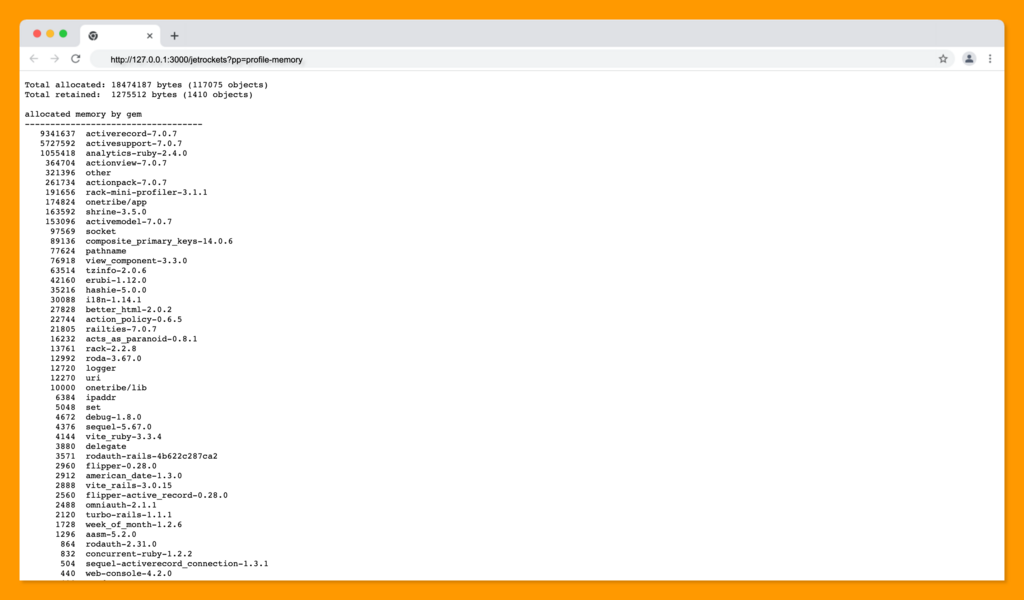
By adding memory_profiler gem to your application bundle, you can also do memory profiling for each request directly in your browser, which is really helpful.

Dockerfile optimization
Dockerfile optimization is crucial in enhancing the overall performance and efficiency of your Ruby on Rails application. Here are some key reasons why Dockerfile optimization impacts your Rails application:
- Container Size and Efficiency: The size of your Docker container directly affects deployment times, resource consumption, and scalability.
- Resource Utilization: Docker containers share resources with the host system. An inefficient Dockerfile can lead to excessive resource consumption, causing performance bottlenecks and potential service interruptions.
- Dependency Management: Docker allows you to package your Rails application and its dependencies together. An optimized Dockerfile defines dependencies explicitly and installs only what’s necessary.
- Reproducibility: Dockerfiles are used to create reproducible environments. An optimized Dockerfile guarantees consistency across development, staging, and production environments.
- Scalability: When your application needs to scale to handle increased traffic, the efficiency of your Docker containers becomes critical.
- CI/CD Pipeline Efficiency: An optimized Dockerfile speeds up your continuous integration and continuous deployment (CI/CD) pipeline.
- Cost Savings: Running containers in the cloud often incurs costs based on resource usage. By optimizing your Docker containers, you can reduce resource utilization, leading to cost savings in terms of infrastructure and cloud services.
For me, Dockerfile optimization is not just a technical concern but a strategic one. It impacts your Ruby on Rails application’s performance, scalability, security, and cost-effectiveness.
The biggest question is how to measure everything states above? There are a lot of articles dedicated to Dockerfile optimization and I will not cover everything in this article, however I want to share one tool that I always use.
#16 Dive
Dive is a powerful console utility explicitly designed for Docker and OCI image exploration. It empowers developers and system administrators to delve deep into the intricacies of these container images. With Dive, you can examine the image layers and uncover valuable insights on optimizing and reducing the overall size of your Docker or OCI image.
Furthermore, Dive can be used with your CI/CD pipelines to make sure that changes made to your Dockerfile do not affect its performance and efficiency.
Caching
Caching can bring a significant performance boost to your applications as well as bring a lot of pain to your life. I don’t know a better manual about caching in Rails than Rails guides: https://guides.rubyonrails.org/caching_with_rails.html.
#17 Dalli
If you decided to use caching in Rails than probably you will end with Memcached as cache store. In this case don’t forget to switch to dalli memcached driver. Originally created by Mike Perham (author of Sidekiq) more than 10 years ago, it is still the best way to use Memcached from Ruby: it is fast, secure and support complex Memcached configurations.
Tests Performance
The last but not the least. Your application tests (specs in my case) should be as fast as possible, long running tests will reduce time that you can afford on everything described above.
#18 Test Prof
Test Prof is a collection of profilers, recipes and RuboCop rules to make your test suite run fast. Of course, this is not a silver bullet, and it requires a lot of manual work, but it gives you instruments to do this work.
As for me, I use let_it_be , before_all, and factory_default in every project, even in a new one, even if the test suite is relatively fast.
Conclusion
It is vital to understand the significance of optimizing Rails applications for better performance. Spending time and resources on this area can lead to significant enhancements. User experience is crucial in today’s competitive digital world. Optimizing Rails applications means more than just improving speed; it also means delivering a more seamless, responsive, and satisfying user experience.
I have provided a thorough overview of different tools and techniques that you can utilize. Moreover, it is essential to note that Ruby and Rails are not dead or slow. Like any other technology, it is important to be diligent with your Ruby code and understand how to enhance it.